Elevation
The GTOPO30 digital elevation model (DEM) was chosen
as the base layer for this project (USGS EDC 1996). This DEM was downloaded
from the USGS EDC website (http://edcdaac.usgs.gov/gtopo30/gtopo30.html).
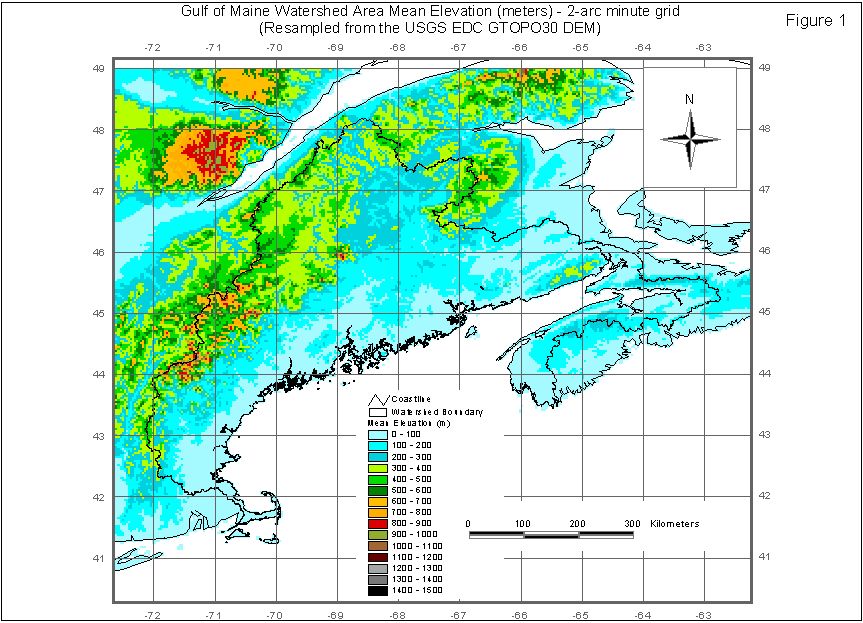
For this project the 30 arc second digital elevation model was resampled
to 2 arc-minute resolution using GHAAS-RGIS (Water Systems Analysis Group,
UNH). Three elevation grids were created for the Gulf of Maine Watershed
Area: minimum, mean and maximum. Table 4 lists
statistics for these grids, minimum grid cell, maximum grid cell, and mean
grid cell. The mean elevation grid was used to create the simulated river
network in GHAAS-RGIS (Water Systems Analysis Group, UNH). Figure
1 illustrates the mean elevation grid for the Gulf of Maine
Watershed Regional Area.
STN-2min River Network
The basin and sub-basin attribute files and the
Simulated Topological Network (STN) were generated from the GTOPO30 DEM
(USGS EDC 1996), which represents topography at 30-second resolution. After
tests of several different grid resolutions on portions of the basin, we
discovered that a 2-arc minute resolution gridded networking system would
be suitable for application at the regional scale. This network has more
than 150,000 individual grid cells within the Gulf of Maine Watershed area.
The final 2min resolution river network represents 825 individual basins,
400 of these have more than a single cell, the remaining 425 basins are
single cells along the coast. There are 190 named basins in the network.
Total watershed area at 2min resolution is 174,825 sq km. This data set
represents a topological structure by which a hierarchy of nested basin
and sub-basin characteristics was derived using existing software we had
already developed (GHAAS-RGIS (Water Systems Analysis Group UNH)).
The grid-based structure was error-checked and edited using 1:1M digital
line graph templates from the Digital Chart of the World (ESRI 1992), high
resolution EPA River Reach files (EPA 1998) and the EDA/CDA basin boundaries
from the NOAA Gulf of Maine Land-based Pollution Sources Inventory (NOAA-EPA).
This river network serves as the organizational structure upon which the
land characterization is based. Summary statistics for these basins in
the Gulf of Maine Watershed include stream order, stream length, and basin
drainage area.
Three levels of manual editing were completed using
additional functions of the software. The initial editing compared the
STN-2min network with the 1:1 million scale Digital Chart of the World
(ESRI 1992). This comparison ensured that the major rivers were simulated
correctly. Any major river, which deviated significantly from the DCW river
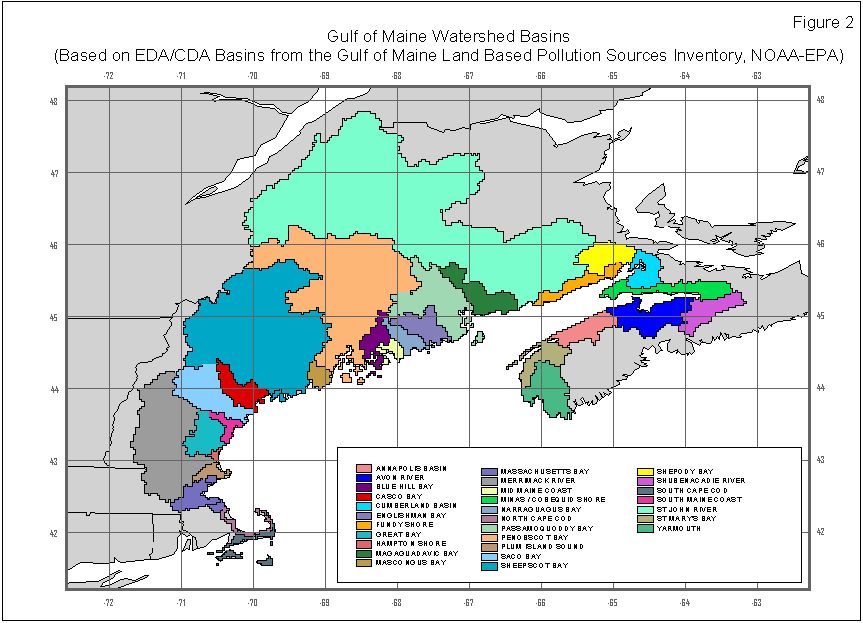
location, was manually edited to create a better match. The second level
of editing compared STN-simulated basin areas with the US EPA EDA/CDA basins
designated for the Gulf of Maine Watershed in the Gulf of Maine Land-Based
Pollution Sources Inventory (NOAA-EPA). Figure 2
shows the Gulf of Maine Watershed EDA/CDA basins. Basin boundaries were
compared and small order river segments were redirected to fall within
basin boundaries. The last level of editing was an integral part of geo-referencing
the stream discharge gauging stations to the simulated river network. Discharge
stations were linked to the stream network and the stations upstream area
was compared to the STN-simulated upstream area for the station. The discharge
stations were georeferenced to the STN 2min river network through an iterative
process. The gage location was adjusted to place the gage on the river
network and minimize the difference between the measured catchment area
and the STN estimated catchment area. These adjustments were made using
the GHAAS-RGIS function STN Characteristics, and the STN Coordinates function
(Water Systems Analysis Group UNH). These procedures linked the station
data to the STN-4km, generated characteristics about the stations, and
then moved the actual stations to the closest reasonable STN cell center
with most similar upstream area using a search algorithm. Upstream
reported areas of the river discharge stations were then compared to the
estimated upstream area of the 2min STN river network. In some cases the
river network was manually edited to improve the area comparison. The manual
editing involved changing the direction of stream reaches grid cell by
grid cell in GHAAS-RGIS (Water Systems Analysis Group UNH).These procedures
were used to ensure that the gridded network would generate accurate representations
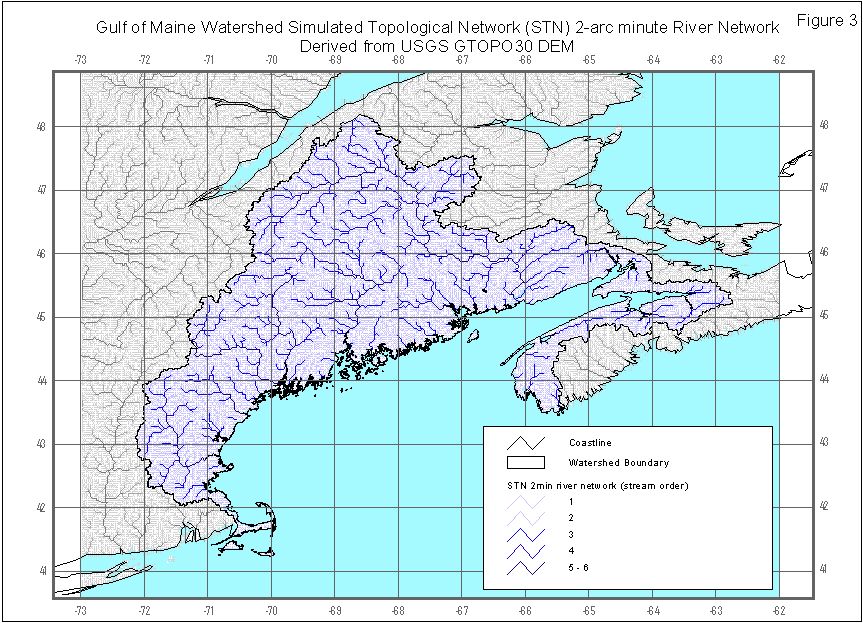
of the actual river networks. Figure 3 illustrates
the manually-corrected STN-2min network. Darker stream segments represent
higher order stream reaches. Stream order is based on the Strahler (1964)
classification. The STN-2min network outside of the Gulf of Maine Watershed
boundary has not been edited.
Land Cover
The land cover grid for the Gulf of Maine Watershed
Region was developed from the USGS North America Land Cover Characteristics
(NALCC) Database (USGS EDC 1999). This data set was developed from 1 km
AVHRR data from April 1992 March 1993. The 1km2 resolution grid for North
America was clipped to the Gulf of Maine Watershed Regional Area (40o
49 o N, 62 o 73 o W), and resampled in ArcGrid (ESRI) using a nearest
neighbor resampling function to create the 2 arc minute grid. Two versions
of the NALCC data set, International Geosphere-Biosphere Programme (IGBP)
and U.S. Geological Survey Land Use/Land Cover System-Legend 2 (USGS-L2),
were converted to the Water Balance Model (WBM) land cover categories (Table
5). The original categories for the IGBP and USGS-L2 legends
are listed in Appendix A. These grids
were compared to check the category conversions and were within 2% agreement.
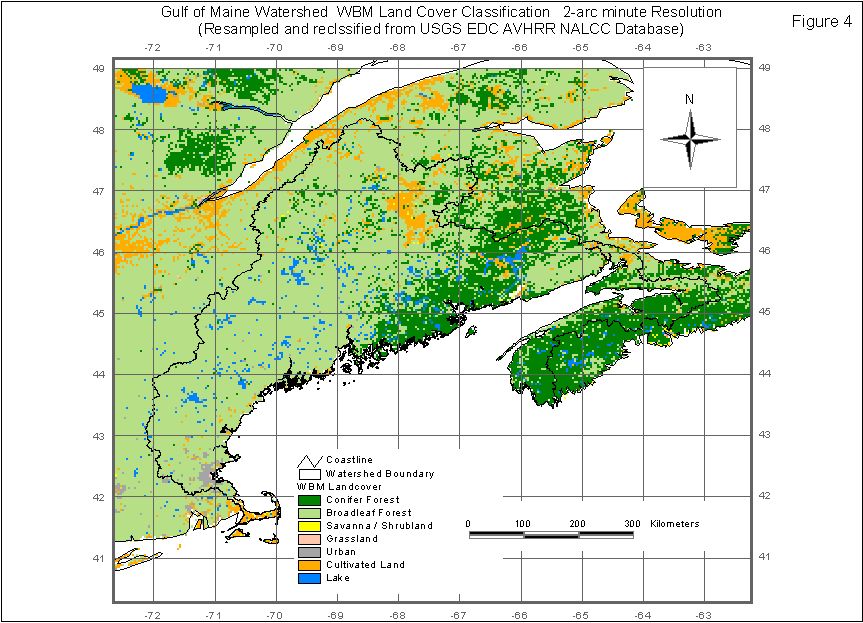
The WBM land cover classification has hydrological importance, since WBM
uses land cover to calculate rooting depth (Vörösmarty et al.
1996, 1998). Figure 4 illustrates the WBM land cover
grid.
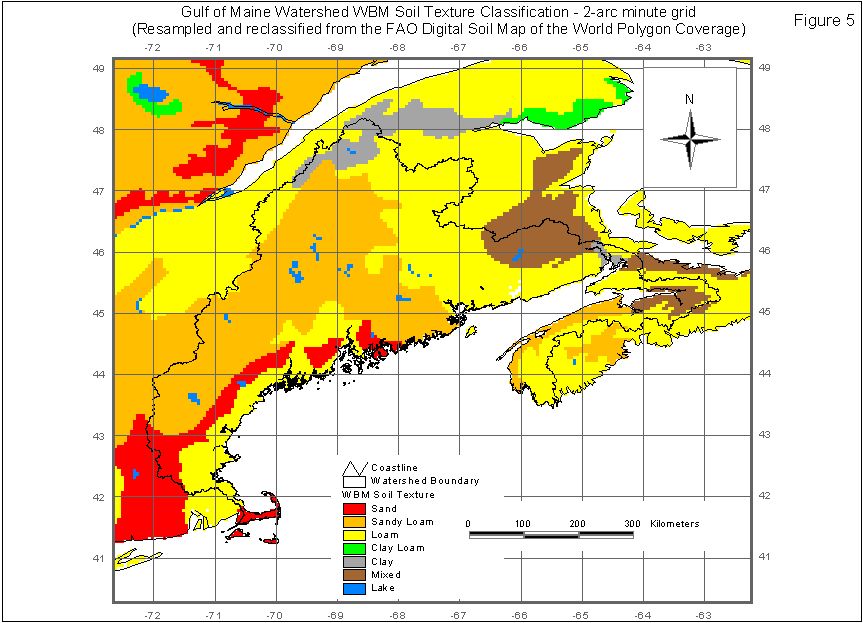
Soils
The soil texture grid for the Gulf of Maine Watershed
Region was developed from the Digital Soil Map of the World CD-ROM, Version
3.5 (FAO 1995). The FAO digital map contains soil unit attributes and slope
and texture codes. The digital map was clipped to the Gulf of Maine Watershed
Regional Area and converted to a 2 arc minute grid. The soil unit, texture
and slope codes were used to create the WBM soil texture classifications
(Vörösmarty et al. 1996, 1998). A slope grid was also created.
The WBM soil texture classifications are listed in table
6. These classifications are based on ¾ majority for the texture,
thus soil units which have a sum of greater than 75% coarse texture are
considered to be coarse, soil units which have a sum of greater than 75%
medium texture are considered to be medium, soil units which have a sum
of greater than 75% fine texture are considered to be fine, etc. Figure
5 illustrates the WBM soil texture grid.
Climate Data (Air Temperature and Precipitation)
The Canadian precipitation and air temperature data
sets were compiled from several sources. Data for 1970-1993 were extracted
from the Environment Canada: Canadian Climate Normals & Monthly Averages
data set (Environment Canada 1993). These data were provided to the project
by collaborators at the University of Delaware. Additional data for 1994-1999
were acquired during the summer of 2000. Monthly values were calculated
from data on the Environment Canada Canadian Daily Climate Data Temperature
and Precipitation CD-ROMs: Quebec 1998 and Atlantic Provinces 1999 (Environment
Canada 1999, 2000). Additional data for Quebec 1999 were acquired as provisional
data directly from the regional Environment Canada office. Monthly data
are reported as total mm of precipitation and average degrees C temperature.
For the 1994-1999 data, monthly values were calculated from daily records.
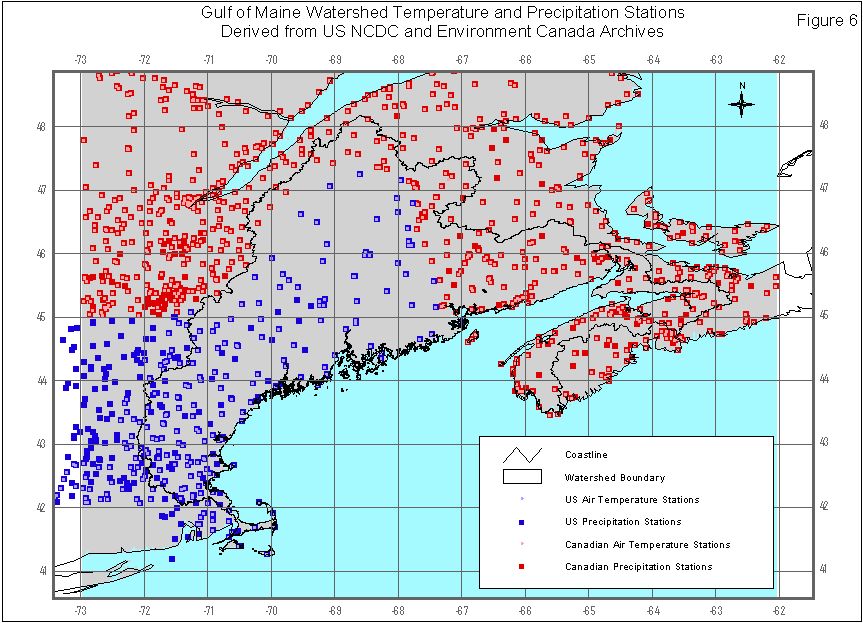
The GM-WICS database includes 798 precipitation stations and 693 air temperature
stations, which were active for some part of 1970-1999 and within the Gulf
of Maine Watershed regional area (39 50 degrees latitude, -61 - -74 degrees
longitude). Stations outside of the Gulf of Maine Watershed were
included in order to minimize interpolation edge effects when interpolation
was applied to produce gridded fields.
The United States precipitation, air temperature,
and snow data were extracted from the National Climatic Data Center (NCDC)
Cooperative Summary of the Day archive. These data were acquired
from the NCDC Cooperative Summary of the Day web site (http://nndc.noaa.gov/).
Daily data values are reported for total inches of precipitation and degrees
Fahrenheit temperature. These data were converted to millimeter of precipitation
and degrees Celsius temperature. Monthly precipitation totals and average
monthly temperatures were calculated from the daily data. There are 356
precipitation stations and 220 temperature stations within the Gulf of
Maine Watershed regional area (39 50 degrees latitude, -61 - -74 degrees
longitude) in the GM-WICS databank.
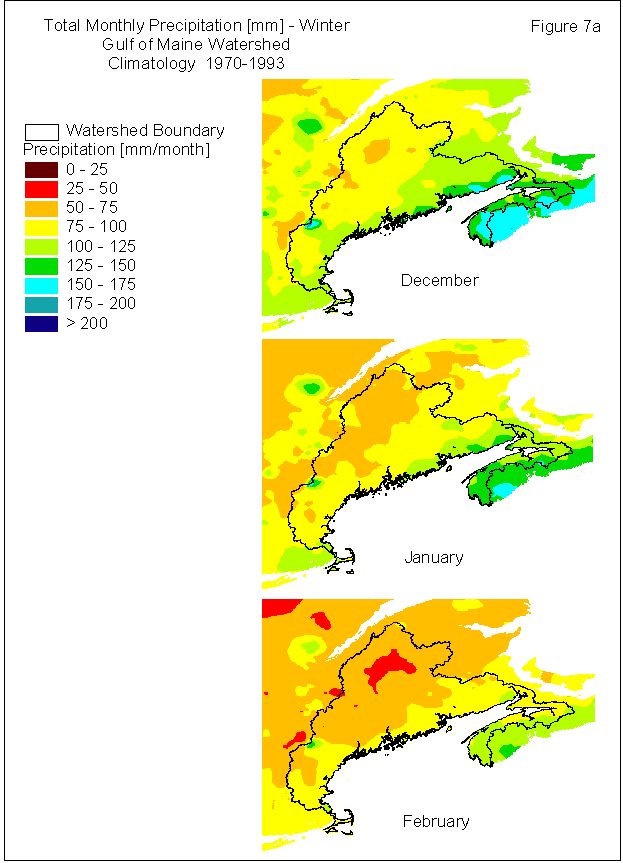
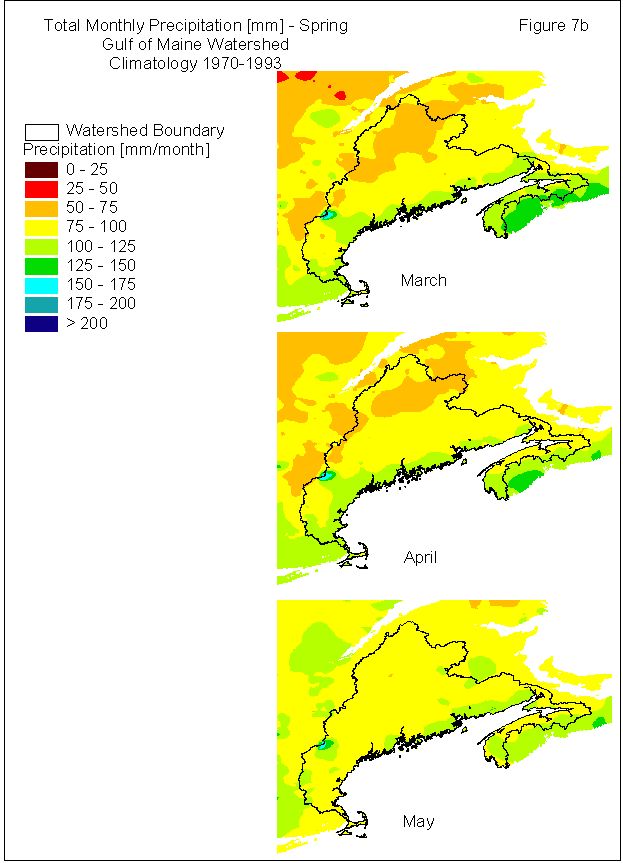
The data from Canada and the United States were
joined to create monthly time series files, station location files and
interpolated climatology and time series data fields. The interpolations
were processed using the Spheremap (NCGIA 1997) function in Data Manager
(Water Systems Analysis Group, UNH). Spheremap is an algorithm that seeks
to overcome variations in the distance between sampling locations that
result from map projections (NCGIA 1997). Spheremap interpolates the data
before projecting them into cartesian space (Willmott et al. 1984). These
files were imported into RGIS and ArcInfo formats for display, visual analysis,
and statistical analysis.
Table
7 provides maximum, minimum, mean and standard deviation statistics
for the precipitation climatology grids. Table 8
provides maximum, minimum, mean and standard deviation statistics for the
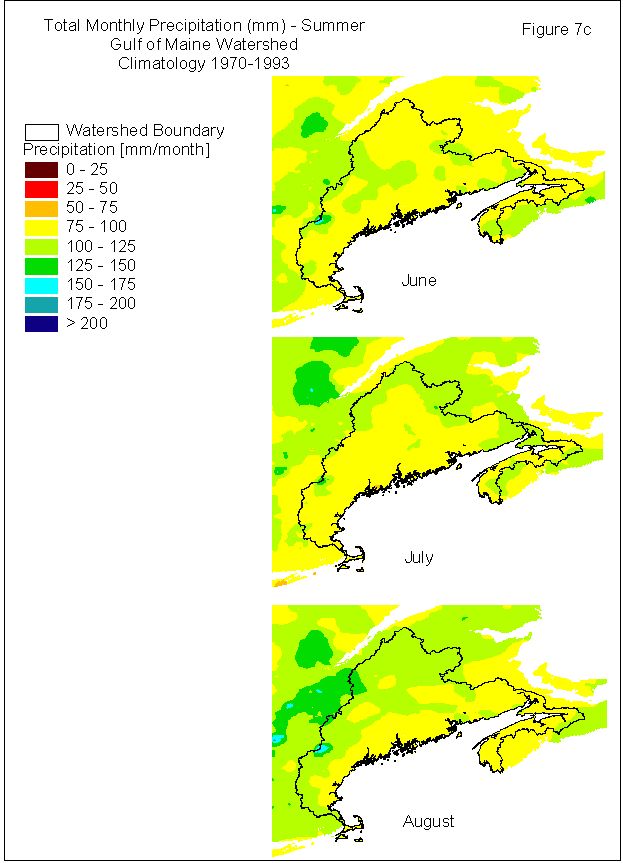
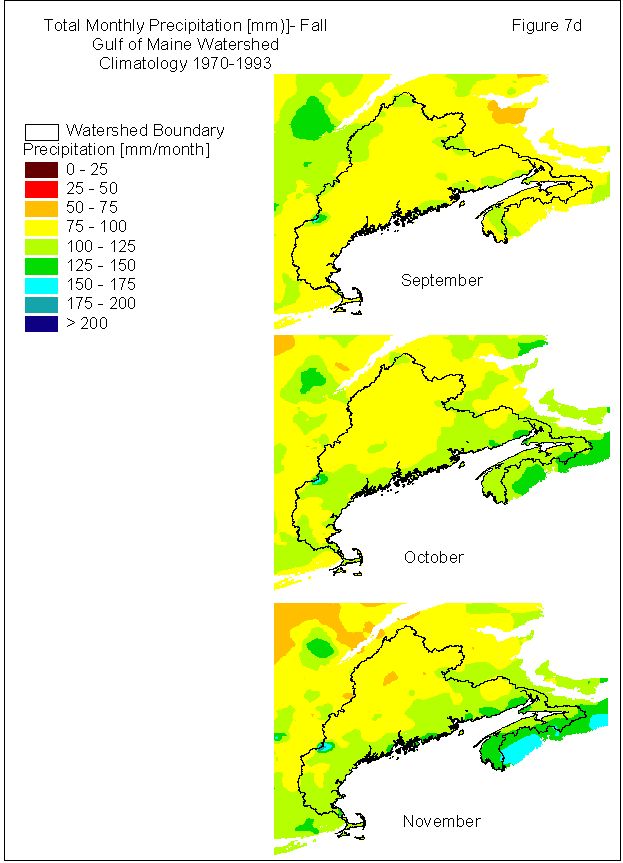
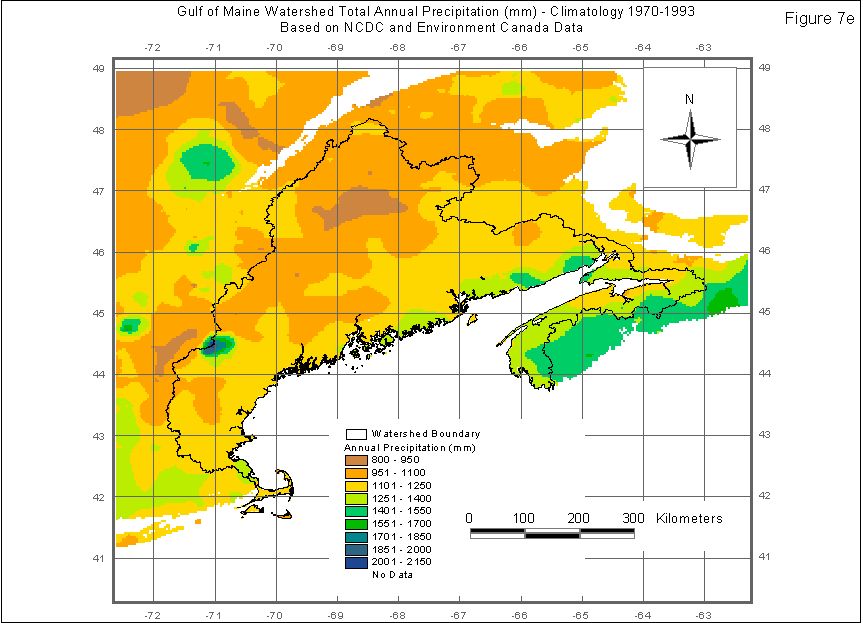
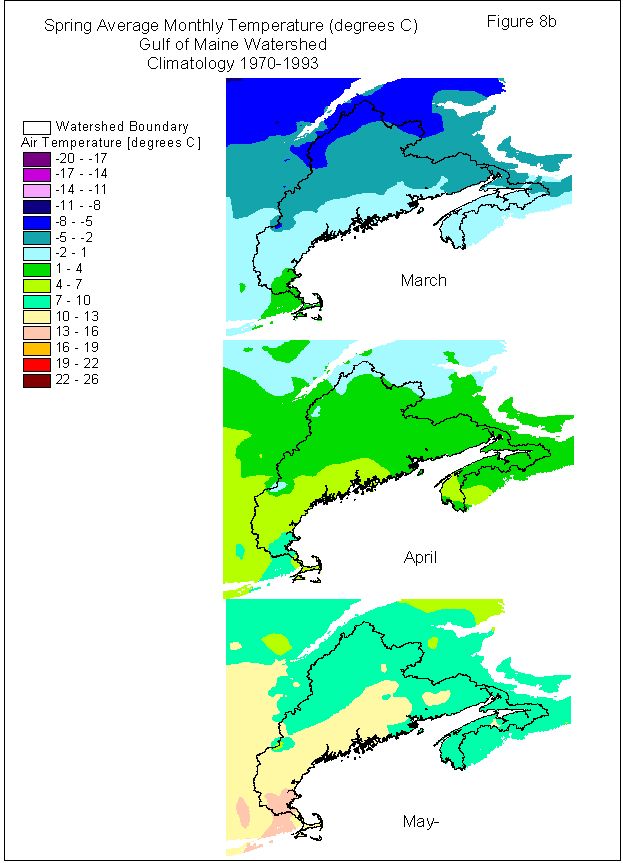
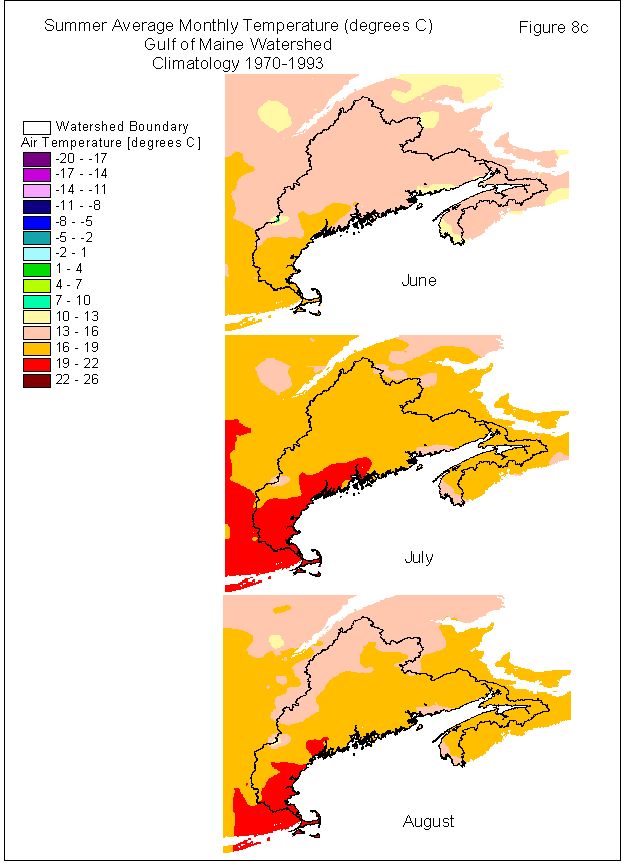
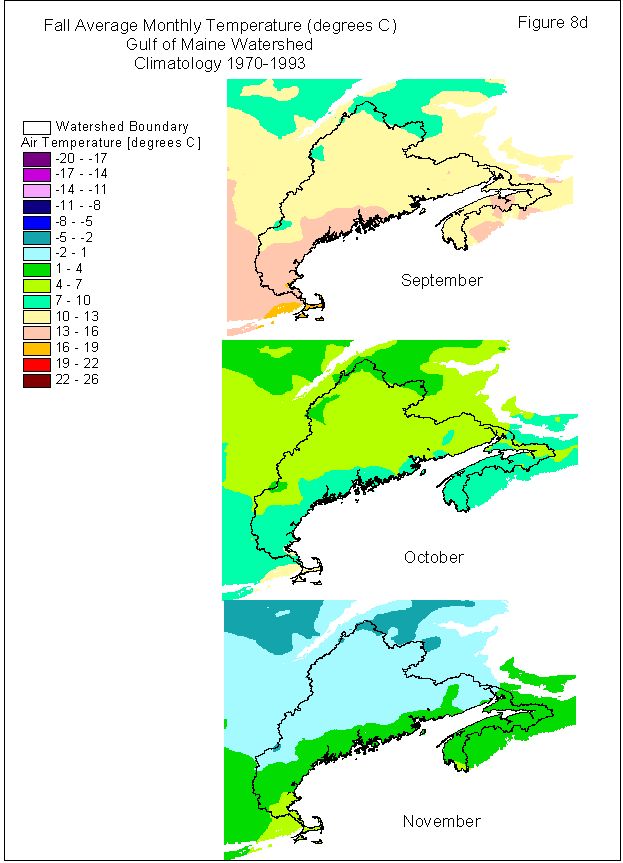
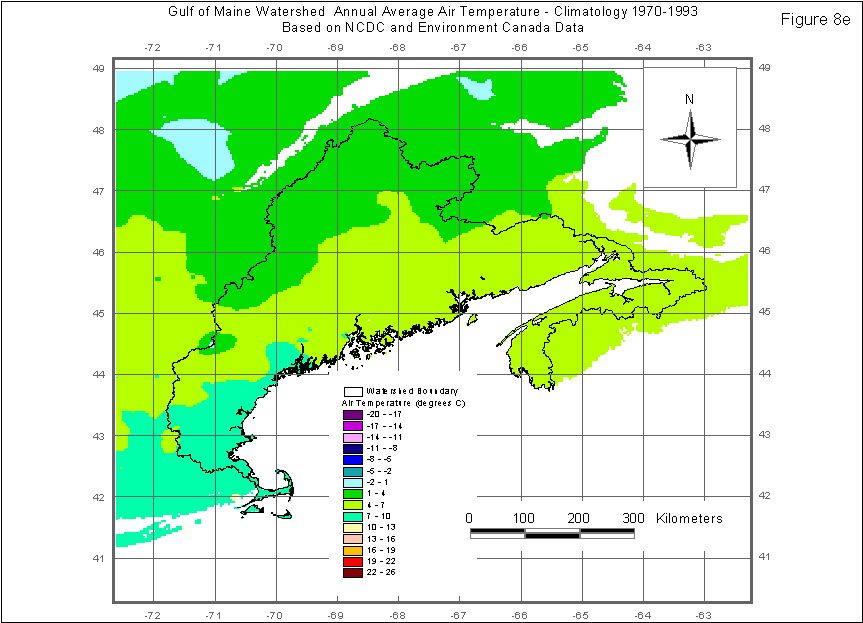
air temperature climatology grids. Figure 6 illustrates
the locations of the air temperature and precipitation stations used for
the climate interpolations. Figures 7(a, b,
c, d, e)
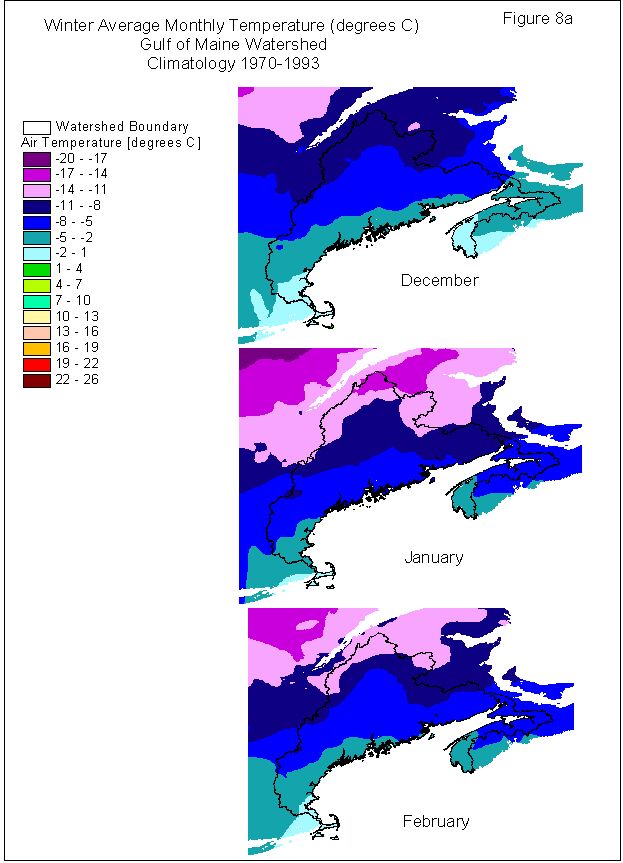
illustrate the climatology interpolations for precipitation. Figures 8(a,
b, c, d,
e) illustrate the climatology interpolations for
air temperature. Point data and the air temperature and precipitation interpolated
time series can be viewed in the Interactive Data Explorer (http://www.gm-wics.unh.edu/explorer/).
Stream Discharge
Canadian stream discharge data were
extracted from the Environment Canada, Atmospheric Environment Service,
Surface Water and Sediment Data, HYDAT CD-ROM version 4.92 (Environment
Canada 1994) and the Environment Canada, Atmospheric Environment Program,
Surface Water and Sediment Data, HYDAT CD-ROM version 98-1.05.8 (GIC 1999).
The entire period of record was extracted for each station that was active
between 1970 and 1999. There are 64 stations within the Gulf of Maine Watershed
area for this time period. The data are reported as daily average stream
(m3 s-1). Tab delimited ASCII (text) files were created for daily average
discharge time series and monthly average discharge time series.
The United States stream discharge data were
extracted from the United States Geological Survey National Water Information
System (NWIS-W) archive (http://waterdata.usgs.gov/nwis-w)
and the Real-Time Water Data web pages. The provisional real-time data
is downloaded on a daily basis and archived as hourly averages at UNH.
The entire period of record was extracted for each station which was active
between 1970 and the present. There are 132 stations within the Gulf of
Maine Watershed area for this time period, real-time data is reported for
106 stations. The archived data were reported as daily average stream discharge
(ft3 s-1). The real-time data is reported as 5 minute or 15 minute instantaneous
measurements in the same units. The real-time, provisional data is archived
at UNH as hourly averages (http://www.gm-wics.unh.edu/html/realtime.html).
All US data were converted to m3 s-1. Tab delimited ASCII (text) files
were created for daily average discharge time series and monthly average
discharge time series. These files were merged with the Canadian data.
As explained earlier, the stations were geo-referenced to the STN using
an iterative process in GHASS-RGIS (Water Systems Analysis Group UNH).
This database includes the stations that drain areas equal to or larger
than 100 km2. Basins smaller than 100 km2 are not adequately represented
by the simulated river network.
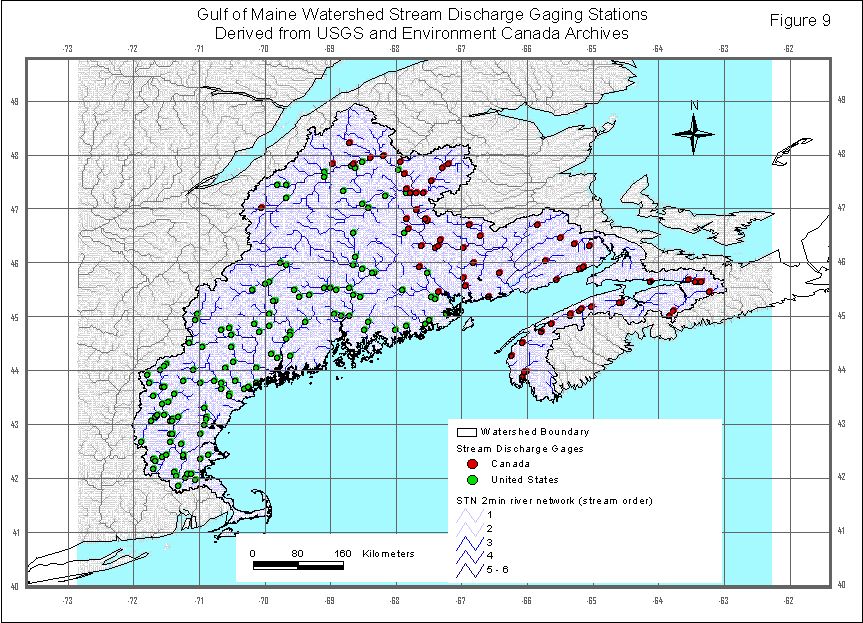
Figure
9 shows the stream discharge gage locations on the STN-2min
simulated river network. Many of the stations fall along large-flow,
higher order segments of the river network.
Table 9 lists the 25 largest river basins
in the Gulf of Maine Watershed STN 2min river network. Table
10 lists stream discharge station statistics, including the comparison
between the measured upstream area and the estimated upstream area for
each discharge station. Figure
10 shows a log-log graphical comparison between the gauging
stations reported drainage area and the drainage area estimated by the
STN 2min river network. There are only a few basins which are significantly
different from the reported upstream area. Figure
11 shows a comparison between cumulative watershed area and
the STN-2min Gulf of Maine basins ranked by size (largest to smallest).
The largest basin, the St. John River, covers 32% of the Gulf of Maine
Watershed Area. The three largest basins, the St. John River, the Kennebec/Androscoggin
River, and the Penobscot River, cover 58% of the watershed area. The 10
largest rivers cover 75% and the 50 largest rivers cover 90% of the watershed
area.
Atmospheric Deposition
The Canadian atmospheric deposition data sets
were extracted from the National Atmospheric Chemistry (NAtChem) database,
the Canadian Precipitation Monitoring Network (CAPMoN) database, and the
New Brunswick Precipitation Monitoring Network (NBPMN) database (Environment
Canada 1999). These data were received from the Environment Canada Air
Quality Research Branch. These data are a combination of daily, weekly
and monthly data. The concentration data are reported as mg L-1. These
data have been formatted into tab delimited ASCII (text) files. There are
39 sampling sites within the Gulf of Maine Watershed regional area (39
50o N, -61 - -74o W).
The United States atmospheric deposition data
set was extracted from the National Atmospheric Deposition Program (NADP)
archive. These data were acquired from the NADP website (http://nadp.sws.uiuc.edu/
default.html). Weekly concentration data were downloaded from this
site. The data are reported in mg L-1 units. These data have been formatted
as tab delimited ASCII (text) files. There are 17 sites within the Gulf
of Maine Watershed regional area (39 50 o N, -61 - -74 o W).
Water Quality
There was no response from Environment Canada regarding
the Canadian water quality database, Envirodat. At this time only the data
codes are available on the web. A response from the Atmospheric Monitoring
and Water Survey Directorate, indicated that data is archived in a central
location through 1992 and has been archived in each region separately since
1992.
The United States water quality data were extracted from the
USGS CD-ROM: Data from Selected U.S. Geological Survey National Stream
Water-Quality Monitoring Networks (WQN) DDS-37(USGS 1996). The physical
parameters, nutrient concentrations (mg L-1) and major ion concentrations
(mg L-1) were formatted to create time series in tab delimited ASCII (text)
format and point coverages of the station locations. These data have not
been added to the web page. There are 22 WQN locations in the Gulf of Maine
Watershed. Based on this limited number of water quality locations, we
chose to focus our analysis of nutrient transport on four basins within
the Gulf of Maine Watershed: the Ipswich and Parker Rivers, Great Bay rivers,
the coastal rivers and streams at Wells NERR, and the Androscoggin /Kennebec
basin. The analysis for the Ipswich and Parker Rivers was done in collaboration
with Plum Island Ecosystem LTER researchers. We worked closely with T.
Loder (CICEET project 11, 1997-1999) on analysis of data from the Lamprey,
Oyster and Salmon Falls Rivers in the Great Bay drainage. In addition,
we worked with T. Loder (CICEET project 11, 1997-1999) on sampling the
Androscoggin/Kennebec river system. With the help of volunteers, we carried
out a year-long sampling program at the mouth of the Kennebec and the Androscoggin
and below the confluence of these rivers. We also worked with seven schools
(Oakland, Carrabassett Valley, Gardiner, Dixfield, Oxford Hills, Lewiston
and Auburn) in the Kennebec/Androscoggin drainage to develop weekly time
series of river nutrient concentrations. Samples taken at the mouth of
the Androscoggin/Kennebec have been used to estimate seasonal nutrient
flux to the coast (Bredensteiner et al., in preparation). We estimate that
1621 metric tons of dissolved inorganic nitrogen (DIN), 127 metric tons
of phosphate (PO4), and 19272 metric tons of silicate (SiO4) were delivered
to the coastal zone by the Androscoggin/Kennebec Rivers in 1999 (Bredensteiner
et al., in preparation). Of particular interest is the snowmelt contribution
to this flux. In order to calculate the contribution of snowpack storage
and subsequent melt to river nutrient flux, we completed five intensive
river and three intensive snowpack sampling trips (River: February 1999,
December 1999, January 2000, February 2000 and March 2000; Snow: February
1999, January 2000, February 2000). We have developed estimates of river
nutrient flux and snowpack storage of inorganic nitrogen, phosphorus and
silica from this data set. We estimate that the snowpack in the Androscoggin/Kennebec
basins stored 760 metric tons of DIN, 11 metric tons of PO4, and 46 metric
tons of SiO4 in 1999, and 1020 metric tons DIN, 13 metric tons of PO4,
and 35 metric tons of SiO4 in 2000 (Bredensteiner et al. in preparation).
Anderson, D.M. 1989. Toxin variability in Alexandrium species. Toxic Marine Phytoplankton. 41-51.
Anderson, D.M. 1994. Red tides. Scientific American, 271: 62-68.
Bredensteiner, K., C. Vörösmarty, T. Loder, E. Penfold, and W. Wollheim. 2000. Regional Estimation of Snowpack Nutrient Storage. (In preparation for submission to Estuaries).
Environment Canada. 1993. Canadian Climate Normals 1961-1990 & Monthly Averages CD-ROM. Data provided by the University of Delaware, 1998. Cort Willmott and Mike Rawlins Center for Climate Research, Department of Geography, University of Delaware, Newark, DE 19716
Environment Canada. 1994. HYDAT CD-ROM Version 4.92. Surface Water and Sediment Data, Atmospheric Environment Service.
Environment Canada. 1999. Quebec 1998: Canadian Daily Climate Data - Temperature and Precipitation. CD-ROM.
Environment Canada. 1999. Quebec: Provisional Canadian Daily Climate Data Temperature and Precipitation. Direct from Region via request.
Environment Canada. 2000. Atlantic Provinces: Canadian Daily Climate Data Temperature and Precipitation. CD-ROM.
Environment Canada. 1999. Canadian National Atmospheric Chemistry Database. Atmospheric Environment Service, 4905 Dufferin Street, Downsview, Ontario, Canada M3H 5T4
Environmental Protection Agency. 1998. U.S. EPA Reach File 1 (RF1) for the Conterminous United States. U.S. Environmental Protection Agency, Office of Science and Technology Washington, D.C <http://www.epa.gov/ owowwtr1/monitoring/rf/rfindex.html>
Environmental Systems Research Institute, Inc (ESRI). 1982-2000. ArcInfo, ArcGrid, ArcTools 8.0.2. Redlands, CA.
Environmental Systems Research Institute, Inc (ESRI). 1992-1999. ArcView GIS 3.2. Redlands, CA.
Environmental Systems Research Institute, Inc (ESRI). 1992. Digital Chart of the World for use with ARC/INFO, Digital Data on CD-ROM. Redlands, CA.
Food and Agriculture Organization (FAO). 1995. Digital Soil Map of the World CD-ROM. Version 3.5. Land and Water Development Division, Food and Agriculture Organization of the United Nations, Rome.
Greenland International Consulting Inc (GIC). 1999. HYDAT CD-ROM Version 98-1.05.8. Surface Water and Sediment Data, Atmospheric Environment Service. Data from Environment Canada Regional Offices.
Hamon, W.R. 1963. Computation of direct runoff amounts from storm rainfall. Int. Assoc. Sci. Hydrol. Publ. 63:52-62.
Maine State Planning Office. 1991. Gulf of Maine Watershed Map and Fact Sheet.
National Academy of Sciences. 1994. Priorities for Coastal Ecosystem Science. Committee to Identify High-Priority Science to Meet National Coastal Needs. National Academy Press, Washington, DC. 88 pp.
NCDC 1999. Cooperative Summary of the Day, National Climatic Data Center, Asheville, NC. NOAA.
NCGIA (National Center for Geographic Information and Analysis). 1997. Spherekit: The Spatial Interpolation Toolkit. University of California, Santa Barbara, CA http://www.ncgia.ucsb.edu/pubs/spherekit/
Nixon, S.W., J.W. Ammerman, L.P. Atkinson, V.M. Berounsky, G. Billen, W.C. Boicourt, W.R. Boynton, T.M. Church, D.M. Ditoro, R. Elmgren, J.H. Garber, A.E. Giblin, R.A. Jahnke, N.J.P. Owens, M.E.Q. Pilson, and S.P. Seitzinger. 1996. The fate of nitrogen and phosphorus at the land-sea margin of the North Atlantic Ocean. Biogeochemistry 35: 141-180.
National Oceanic and Atmospheric Administration and Environmental Protection Agency (NOAA-EPA). 1996. Gulf of Maine Land Based Pollution Sources Inventory. http://www-orca.nos.noaa.gov/projects/gomaine/
Pearce, J. and G. Wallace. 1995. The Health of the Gulf of Maine Ecosystem: Cumulative Impacts on Multiple Stressors, Dartmouth College Hanover, New Hampshire, Regional Association for Research on the Gulf of Maine.
Pierce, L.T. 1958. Estimating seasonal and short-term fluctuations in evapotranspiration from meadow crops. Bulletin of American Meteorological Society 39:73-78.
Smayda, T.J. 1990. Novel and nuisance phytoplankton blooms in the sea: Evidence for a global epidemic. Toxic Marine Phytoplankton. pp. 29-40.
Strahler, A. N. 1964. Quantitative geomorphology of drainage basins and channel networks Handbook of Applied Hydrology. Chow, V.T. Editor, McGraw-Hill Book Company, Inc.
United States Geologic Survey (USGS) Earth Resources Observation Systems (EROS) Data Center (EDC). 1996. Global 30 Arc Second Elevation Data Set (GTOPO30). Sioux Falls, South Dakota http://edcdaac.usgs.gov/gtopo30/gtopo30.html
United States Geologic Survey (USGS). 1996. Data from Selected U.S. Geological Survey National Stream Water-Quality Monitoring Networks (WQN) DDS-37 CD-ROM. Reston, VA.
United States Geologic Survey (USGS) Earth Resources Observation Systems (EROS) Data Center (EDC). 1999. North American Land Cover Characteristics Database (NALCC), Sioux Falls, South Dakota http://edcdaac.usgs.gov/glcc/na_int.html
United States Geologic Survey (USGS). 1998. NWIS-W Historical Stream Discharge Archive. http://waterdata.usgs.gov/nwis-w/US/ Reston, VA
United States Geologic Survey (USGS). 2000. Real-Time Water Data Pages, http://water.usgs.gov/realtime.html State offices (Maine, Massachusetts, New Hampshire)
Vörösmarty, C.J., B. Moore, M.P. Gildea, B. Peterson, J. Melillo, D. Kicklighter, J. Raich, E. Rastetter, and P. Steudler. 1989. A continental-scale model of water balance and fluvial transport: application to South America. Global Biogeochemical Cycles 3:241-365.
Vörösmarty, C.J., C.J. Wilmott, B.J. Choudhury, A. L. Schloss, T.K. Stearns, S.M. Robeson, and T.J. Dorman. 1996. Analyzing the discharge regime of a large tropical river through remote sensing, ground-based climatic data, and modeling. Water Resources Research 32:3137-50.
Vörösmarty, C.J., C.A. Federer, and A. Schloss. 1998. Potential evaporation functions compared on U.S. watersheds: Implications for global-scale water balance and terrestrial ecosystem modeling. Journal of Hydrology 207:147-69.
Vörösmarty, C.J. and B. Moore. 1991. Modeling basin-scale hydrology in support of physical climate and global biogeochemical studies: an example using the Zambezi River. Stud. Geophys 12:271-311.
Water Systems Analysis Group, University of New Hampshire (UNH). 1996. Data Assembler 1.3. Developed at the Water Systems Analysis Group, Complex Systems Research Center, University of New Hampshire, Durham, NH.
Water Systems Analysis Group, University of New Hampshire (UNH). 1996. Data Set Manager 2.0. Developed at the Water Systems Analysis Group, Complex Systems Research Center, University of New Hampshire, Durham, NH.
Water Systems Analysis Group, University of New Hampshire (UNH). 1994-2000. Global Hydrologic Archive and Analysis System-RiverGIS (GHAAS-RGIS) Version 2.1. Developed at the Water Systems Analysis Group, Complex Systems Research Center, University of New Hampshire, Durham, NH.
Willmott, C.J., C.M. Rowe, and W.D. Philpot. 1984. Spheremap. Center
for Climatic Research, Department of Geography, University of Delaware,
Newark DE.
1 Gulf of Maine Watershed Area 2-arc minute Mean Elevation Grid. This grid was created from the USGS EDC GTOPO30 30-arc second digital elevation model. GTOPO30 DEM was resampled using a nearest neighbor resampling algorithm in ArcGrid (ESRI).
2 Gulf of Maine Watershed Basins. Basins created from the edited Simulated Topology Network (STN) River Network. The subbasins river networks were edited to match the EDA/CDA Basins used in the Gulf of Maine Land Based Pollution Sources Inventory, a joint project between the National Oceanic and Atmospheric Administration (NOAA) and the Environmental Protection Agency (EPA).
3 Gulf of Maine Watershed 2-arc minute Simulated Topological Network (STN) River Network. This network was created using a branching search algorithm in GHAAS-RGIS from the Gulf of Maine Watershed Area 2-arc minute mean elevation grid.
4 Gulf of Maine Watershed 2-arc minute Land Cover Grid (Water Balance Model classification). This grid was created from the USGS EDC 1-km AVHRR North American Land Cover Classification Database. The grid was resampled and reclassified using ArcGrid (ESRI).
5 Gulf of Maine Watershed Area 2-arc minute Soil Texture Grid (Water Balance Model categories). This grid was created from the FAO Digital Soil Map of the World (original scale 1:5,000,000). The polygon coverage was converted to grid format in ArcInfo (ESRI) and the grid was reclassified in ArcGrid (ESRI).
6 Gulf of Maine Watershed Region Air Temperature and Precipitation Stations. These stations were compiled from the US National Climatic Data Center Archives and the Environment Canada Archives. These are the stations that were active between 1970 and the present. There are 913 air temperature stations and 1154 precipitation stations.
7a Gulf of Maine Watershed Winter (December, January, March) Precipitation Climatology Grids. These grids were created using the spheremap interpolation algorithm in Data Manager (DM) (WSAG UNH). The grids represent the mean of total monthly precipitation for 1970-1993.
7b Gulf of Maine Watershed Spring (March, April, May) Precipitation Climatology Grids. These grids were created using the spheremap interpolation algorithm in Data Manager (DM) (WSAG UNH). The grids represent the mean of total monthly precipitation for 1970-1993.
7c Gulf of Maine Watershed Summer (June, July, August) Precipitation Climatology Grids. These grids were created using the spheremap interpolation algorithm in Data Manager (DM) (WSAG UNH). The grids represent the mean of total monthly precipitation for 1970-1993.
7d Gulf of Maine Watershed Fall (September, October, November) Precipitation Climatology Grids. These grids were created using the spheremap interpolation algorithm in Data Manager (DM) (WSAG UNH). The grids represent the mean of total monthly precipitation for 1970-1993.
7e Gulf of Maine Watershed Total Annual Precipitation Climatology Grids. These grids were created using the spheremap interpolation algorithm in Data Manager (DM) (WSAG UNH). The grids represent the mean of total annual precipitation for 1970-1993.
8a Gulf of Maine Watershed Winter (December, January, March) Air Temperature Climatology Grids. These grids were created using the spheremap interpolation algorithm in Data Manager (DM) (WSAG UNH). The grids represent the mean monthly air temperature for 1970-1993.
8b Gulf of Maine Watershed Spring (March, April, May) Air Temperature Climatology Grids. These grids were created using the spheremap interpolation algorithm in Data Manager (DM) (WSAG UNH). The grids represent the mean monthly air temperature for 1970-1993.
8c Gulf of Maine Watershed Summer (June, July, August) Air Temperature Climatology Grids. These grids were created using the spheremap interpolation algorithm in Data Manager (DM) (WSAG UNH). The grids represent the mean monthly air temperature for 1970-1993.
8d Gulf of Maine Watershed Fall (September, October, November) Air Temperature Climatology Grids. These grids were created using the spheremap interpolation algorithm in Data Manager (DM) (WSAG UNH). The grids represent the mean monthly air temperature for 1970-1993.
8e Gulf of Maine Watershed Mean Annual Air Temperature Grid. These grids were created using the spheremap interpolation algorithm in Data Manager (DM) (WSAG UNH). The grids represent the mean annual air temperature for 1970-1993.
9 Gulf of Maine Watershed Stream Dischage Gage Locations. These stations were compiled from the U.S. Geologic Survey NWIS-W Historical Archive, the U.S. Geologic Survey Real-time, Provisional Data Web Sites, and the Environment Canada HY-DAT Archives.
10 Stream Discharge Gaging Stations Upstream Area Comparison between Reported Drainage Areas and Simulated Drainage Areas. This graph highlights the close fit in drainage area between the simulated basins and the reported basin area.
11 Gulf of Maine Watershed Cumulative Land Area Graph. This graph highlights the size of the large river basins within the Gulf of Maine Watershed. The St. John basin covers 32% of the GOM watershed area and the 10 largest rivers cover 75% of the GOM watershed area.
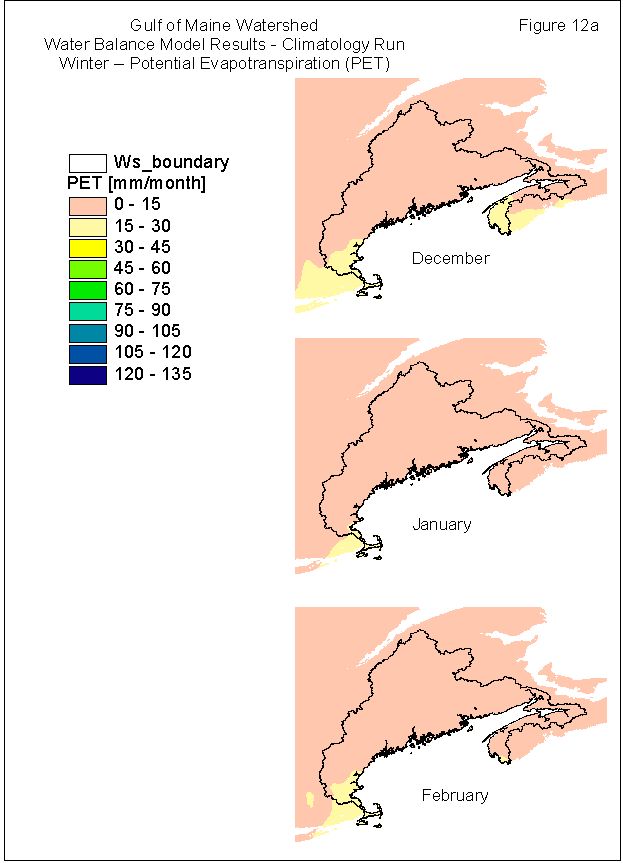
12a Gulf of Maine Watershed Water Balance Model Results Winter (December, January, February) Potential Evapotranspiration Grids. These output grids are results from a WBM simulation which used the air temperature and precipitation climatology grids as input layers.
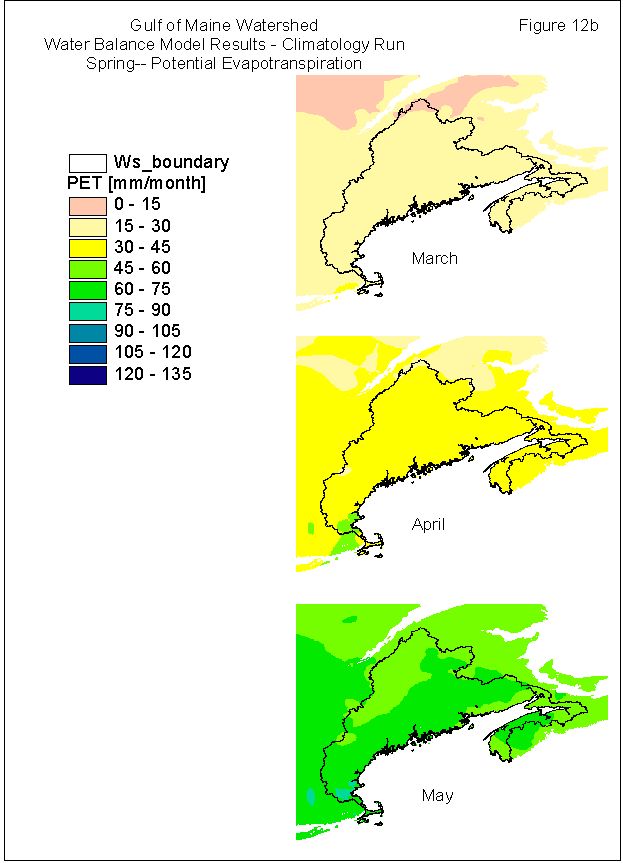
12b Gulf of Maine Watershed Water Balance Model Results Spring (March, April, MAy) Potential Evapotranspiration Grids. These output grids are results from a WBM simulation which used the air temperature and precipitation climatology grids as input layers.
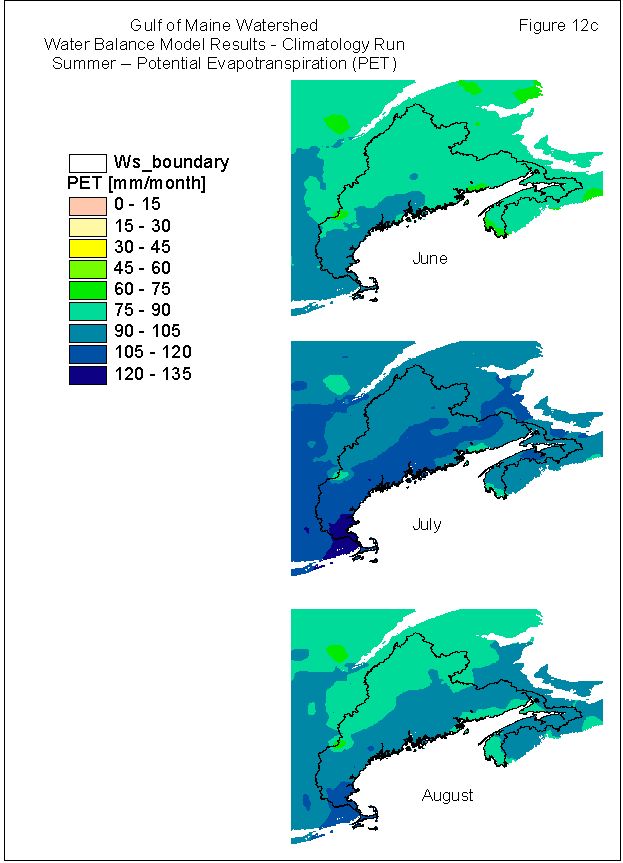
12c Gulf of Maine Watershed Water Balance Model Results Summer (June, July, August) Potential Evapotranspiration Grids. These output grids are results from a WBM simulation which used the air temperature and precipitation climatology grids as input layers.
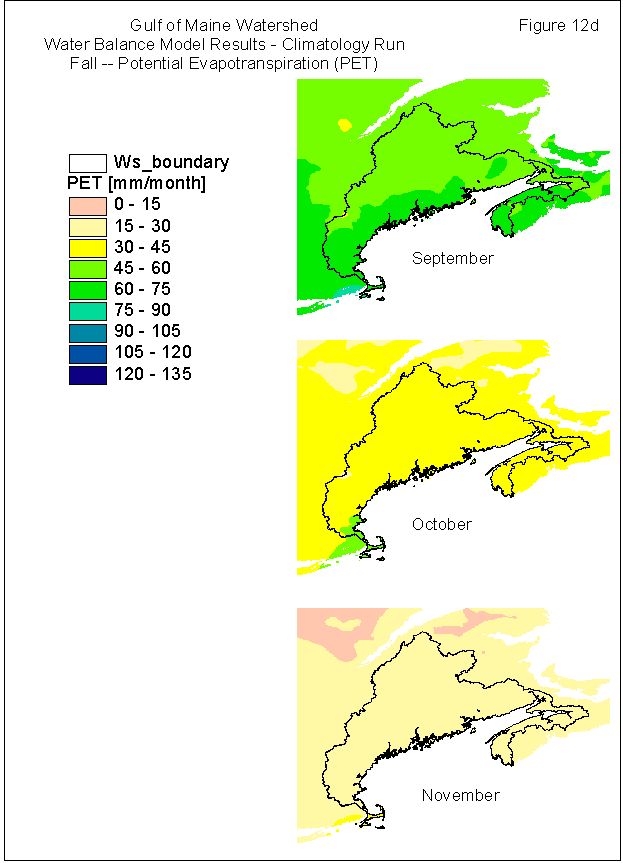
12d Gulf of Maine Watershed Water Balance Model Results Fall (September, October, November) Potential Evapotranspiration Grids. These output grids are results from a WBM simulation which used the air temperature and precipitation climatology grids as input layers.
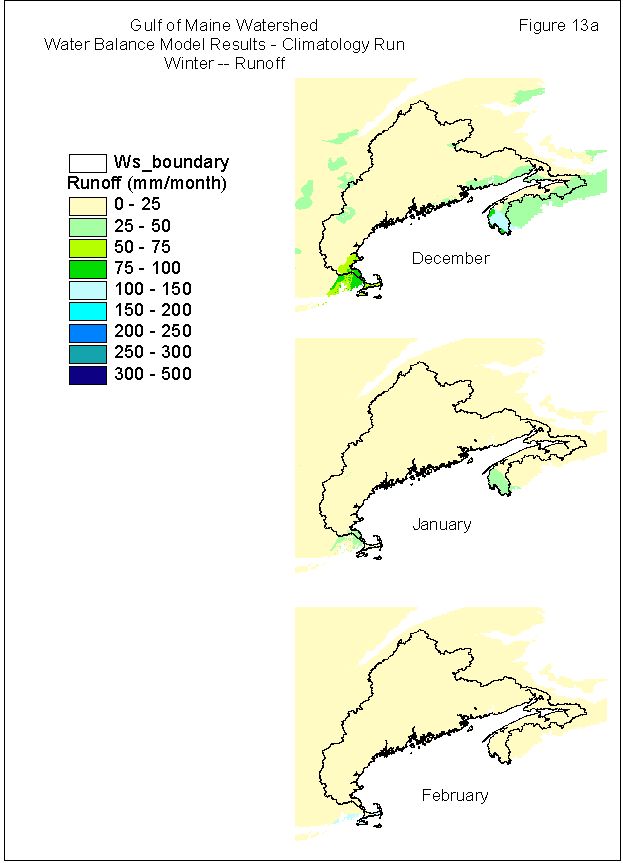
13a Gulf of Maine Watershed Water Balance Model Results Winter (December, January, February) Runoff Grids. These output grids are results from a WBM simulation which used the air temperature and precipitation climatology grids as input layers.
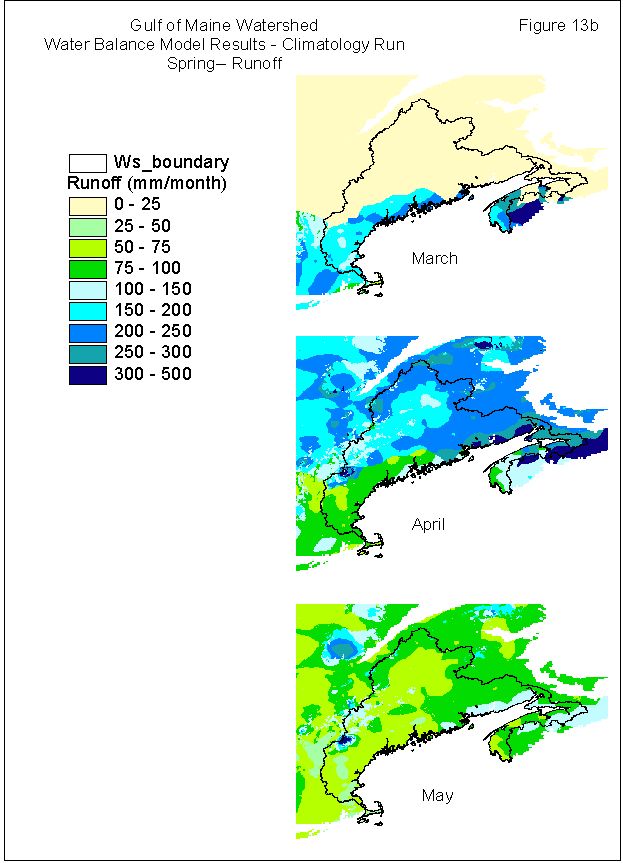
13b Gulf of Maine Watershed Water Balance Model Results Spring (March, April, May) Runoff Grids. These output grids are results from a WBM simulation which used the air temperature and precipitation climatology grids as input layers.
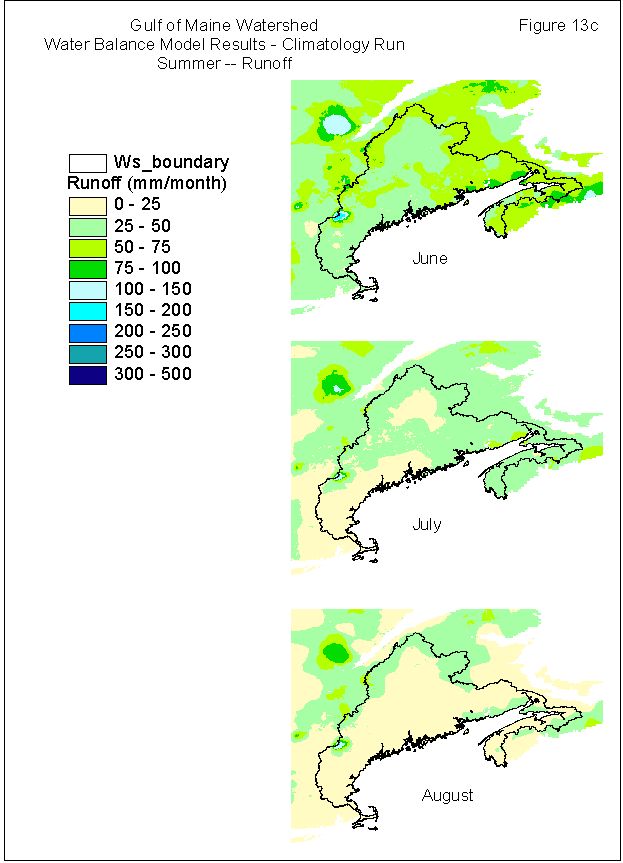
13c Gulf of Maine Watershed Water Balance Model Results Summer (June, July, August) Runoff Grids. These output grids are results from a WBM simulation which used the air temperature and precipitation climatology grids as input layers.
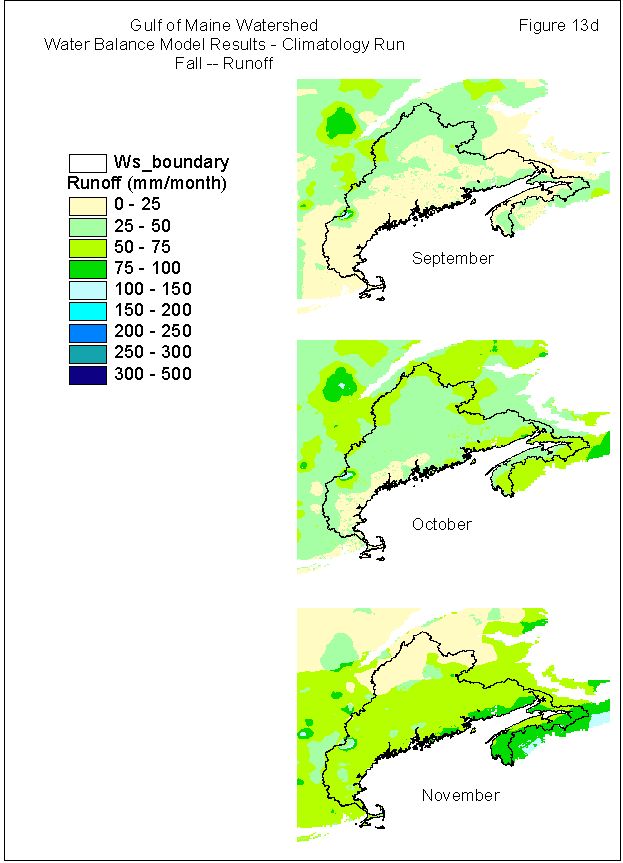
13d Gulf of Maine Watershed Water Balance Model
Results Fall (September, October, November) Runoff Grids. These output
grids are results from a WBM simulation which used the air temperature
and precipitation climatology grids as input layers.